Chapter 1 of 13 · Basics · 10 min read
How to Read Video Scopes
Video scopes measure the picture instead of describing it. Your eyes adapt to whatever they look at for more than a few seconds, every screen shows colour a little differently, and a warm room or a bright window changes what you think you see. A scope reads the actual values in every pixel, so a cast, a crushed black or an over-saturated red shows up as a shape you can recognise, whatever the screen.
The studio has four scopes in the Scopes column on the right: Waveform, Parade, Vectorscope and Histogram, with up to two showing at once. This chapter explains how to read each one on a test chart, because a chart has known values: when you know what a grey wedge and a colour chart should look like, you can read any other footage. Every later chapter, from white balance to shot matching, relies on the scopes, so it is worth learning them first.
Video guide
How to Read Video Scopes: Waveform, Parade and Vectorscope
Chapters
Why colourists trust scopes over their eyes
Human vision is built to discount the colour of light. Stare at a warm shot for a minute and it starts to look neutral; switch to the next shot and that one looks blue. Colourists call this adaptation, and it is the main reason grades drift over a long session. Scopes don’t adapt, so they are the fixed reference you check your judgement against.
They also answer questions the eye can’t: is the white shirt clipped or just bright? Is the black really at black, or a dark grey that will look milky on a phone? Is the skin on the left of the frame the same hue as the skin on the right? Each scope is a different view of the same numbers; you glance between them and the picture, never grade from the scopes alone.
The waveform: level across the frame
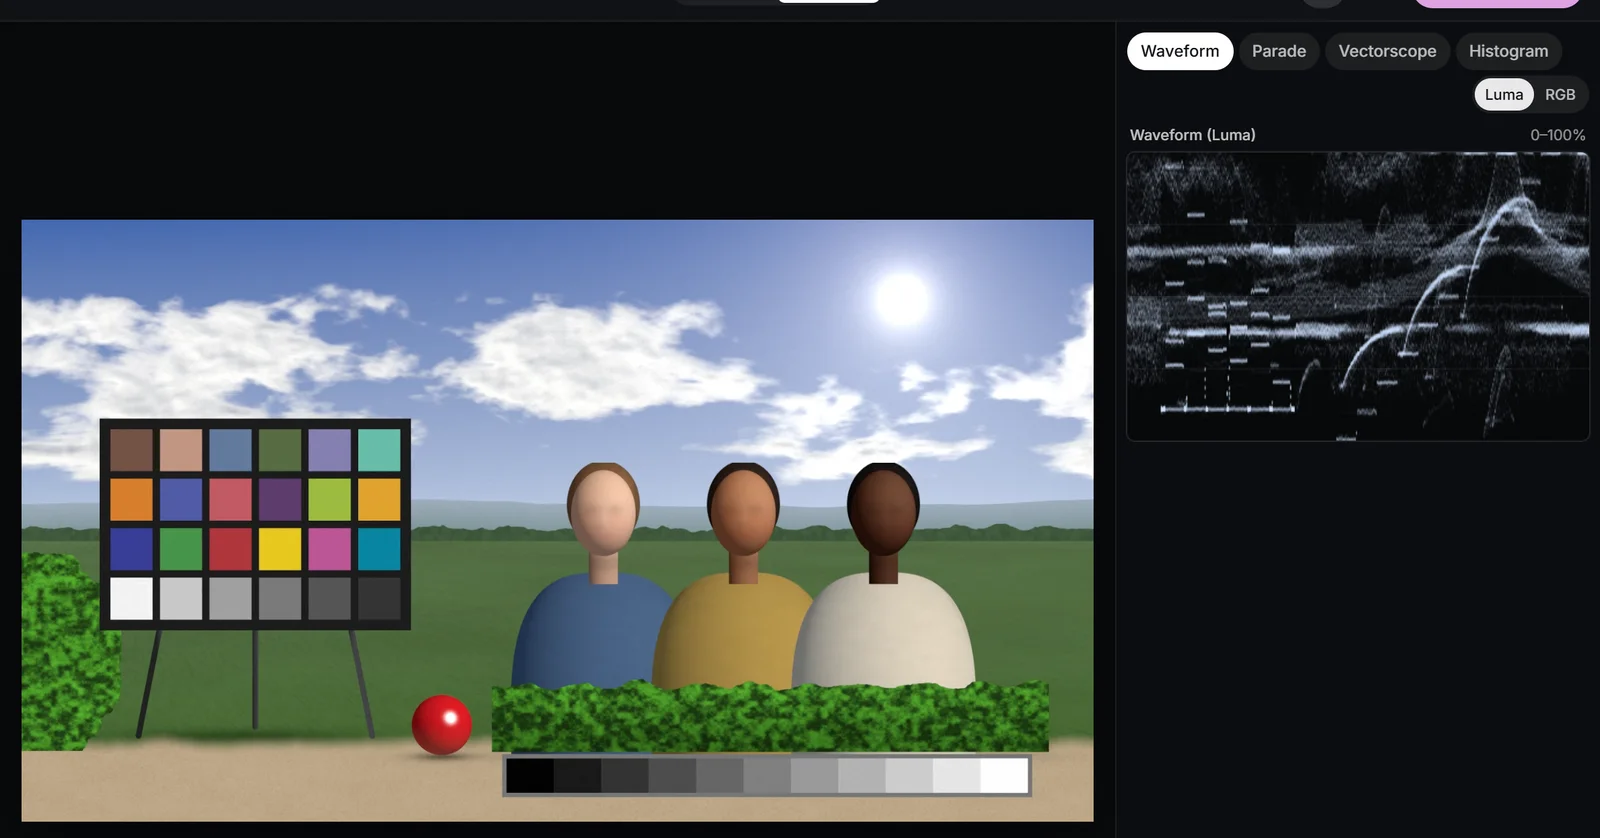
A waveform keeps the horizontal layout of the picture and throws away the vertical one. Each column of pixels in the frame becomes a column on the scope, and every pixel in that column is plotted at the height of its level. So a bright sky across the top of a shot and a bright shirt at the bottom both land near the top of the waveform, at their own left-to-right positions.
The scale runs from 0% (black) to 100% (white). A grey wedge, a strip of evenly spaced grey steps, appears as a staircase: the darkest step is a short line near 0%, the lightest one near 100%, and the steps between are evenly spaced if the camera and grade are behaving. That makes a wedge the quickest test of what a control really does: watch which steps move and which stay put.
 (enlarge image)
The grey wedge as a staircase on the Waveform (Luma).
Luma or RGB
The Waveform has a Luma / RGB toggle. Luma plots the weighted brightness of each pixel (Rec.709 luma, which counts green most and blue least), which is what you want for setting levels. RGB draws the red, green and blue traces on top of each other: where they coincide they add up to white, and where a channel separates you see a coloured fringe. A neutral wedge reads as a white staircase; a warm cast shows a red staircase sitting above a blue one.
Rough landmarks
- Black: the deepest shadows touch 0-2%. Sitting at 8-10% looks lifted and flat.
- Mid grey: an 18% grey card lands at roughly 40-45%.
- Skin: usually between 40% and 70%, depending on complexion and light. There is no single correct number.
- White: diffuse whites such as paper or a shirt sit around 85-95%; only speculars and light sources need to reach 100%.
The RGB parade: three waveforms side by side
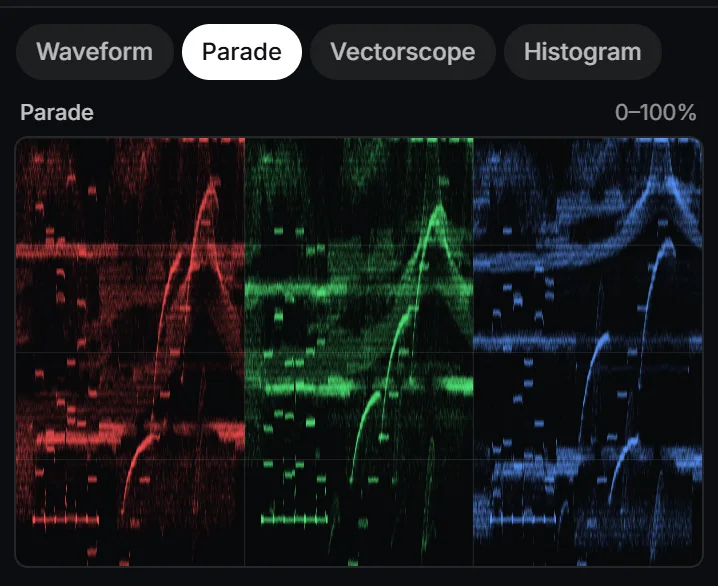
The Parade is the waveform split into three: red on the left, green in the middle, blue on the right, each on the same 0-100% scale. It is the scope for colour balance, because comparing three heights side by side is far easier than untangling an overlay.
The rule is simple: on something neutral, the three traces should match. White paper, grey concrete, a grey wedge and black velvet all reflect red, green and blue equally, so if their traces don’t line up, the difference came from the light or the camera. How they differ tells you what kind of cast it is:
- Red higher than blue at the top, but equal at the bottom: a cast that scales with light, typical of tungsten light. Temperature or the Gain wheel fixes it.
- The same gap at every level: a cast added evenly, often from flare or a bad conversion. The Offset wheel fixes it.
- A gap only near the bottom: tinted blacks. The Lift wheel fixes it.
 (enlarge image)
On a balanced shot, the three Parade traces match over neutral areas.
The white balance chapter uses the parade to neutralise a tungsten cast, and the colour wheels chapter shows exactly which part of each trace each wheel moves.
The vectorscope: hue and saturation
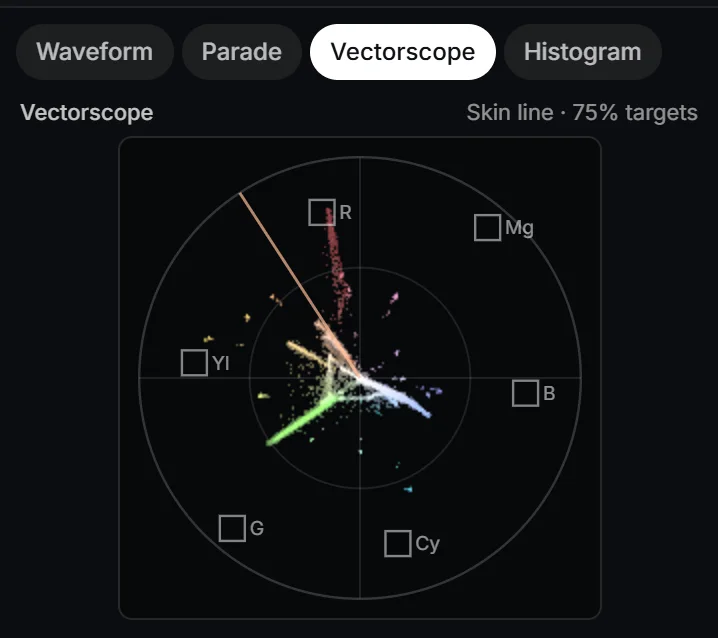
The Vectorscope ignores level altogether and plots colour on a circle. The angle of a point is its hue and its distance from the centre is its saturation. Anything neutral, from black through grey to white, sits on the centre dot, so a cast shows up as the whole cloud of points drifting off-centre in one direction.
The small boxes are the 75% colour-bar targets: where the red, magenta, blue, cyan, green and yellow bars of a standard 75% test signal land. They act as a compass for hue, and a rough limit for saturation: real-world colours rarely need to go past them, and strongly saturated colours beyond them are the ones that bleed and block after compression and fail broadcast checks.
| Colour | Position (clock face) | Opposite |
|---|---|---|
| Red | Just left of 12 | Cyan |
| Magenta | About 1 to 2 | Green |
| Blue | Just below 3 | Yellow |
| Cyan | Between 5 and 6 | Red |
| Green | About 7 to 8 | Magenta |
| Yellow | Just above 9 | Blue |
| Skin tone line | About 11 | Cyan-blue |
The skin tone line
Human skin, from the palest to the deepest, has a remarkably similar hue: it differs mostly in level and saturation. On the vectorscope that hue falls along one line, between the red and yellow targets, which the studio draws as the skin tone line. If faces sit on or just around it, they read as natural; a face pulled towards green or magenta shows as a cluster off the line long before it looks obviously wrong. The skin tones chapter builds on this.
 (enlarge image)
Hue as angle, saturation as distance: the chart on the Vectorscope.
The histogram, and what legal range means
The Histogram counts how many pixels sit at each level, from black on the left to white on the right. It is good for one question, how the tones are distributed overall, and blind to another: where they are. A tall spike at the right edge means many pixels are clipped, but only the waveform or the Clipping view tells you whether that is the sky or a face. Use it as a quick summary, not a precise tool.
Legal and broadcast range, briefly
In 8-bit Rec.709 video, black is stored as code 16 and white as code 235, not 0 and 255; the room left over is headroom. The waveform’s 0% and 100% correspond to those two codes. Broadcasters ask for programmes to stay within that range, allowing only a small margin either side, and limit how saturated colours may be. That is what “legal” or “broadcast safe” means.
For video bound for the web and phones, nobody checks legality, but the same limits still matter in practice: players clip anything outside 0-100%, so detail you leave there is lost. Keep the picture inside the scale and keep saturated colours within the 75% targets unless you have a reason not to. The delivery chapter covers export settings and ranges in more depth.
False colour and clipping: scopes on the picture
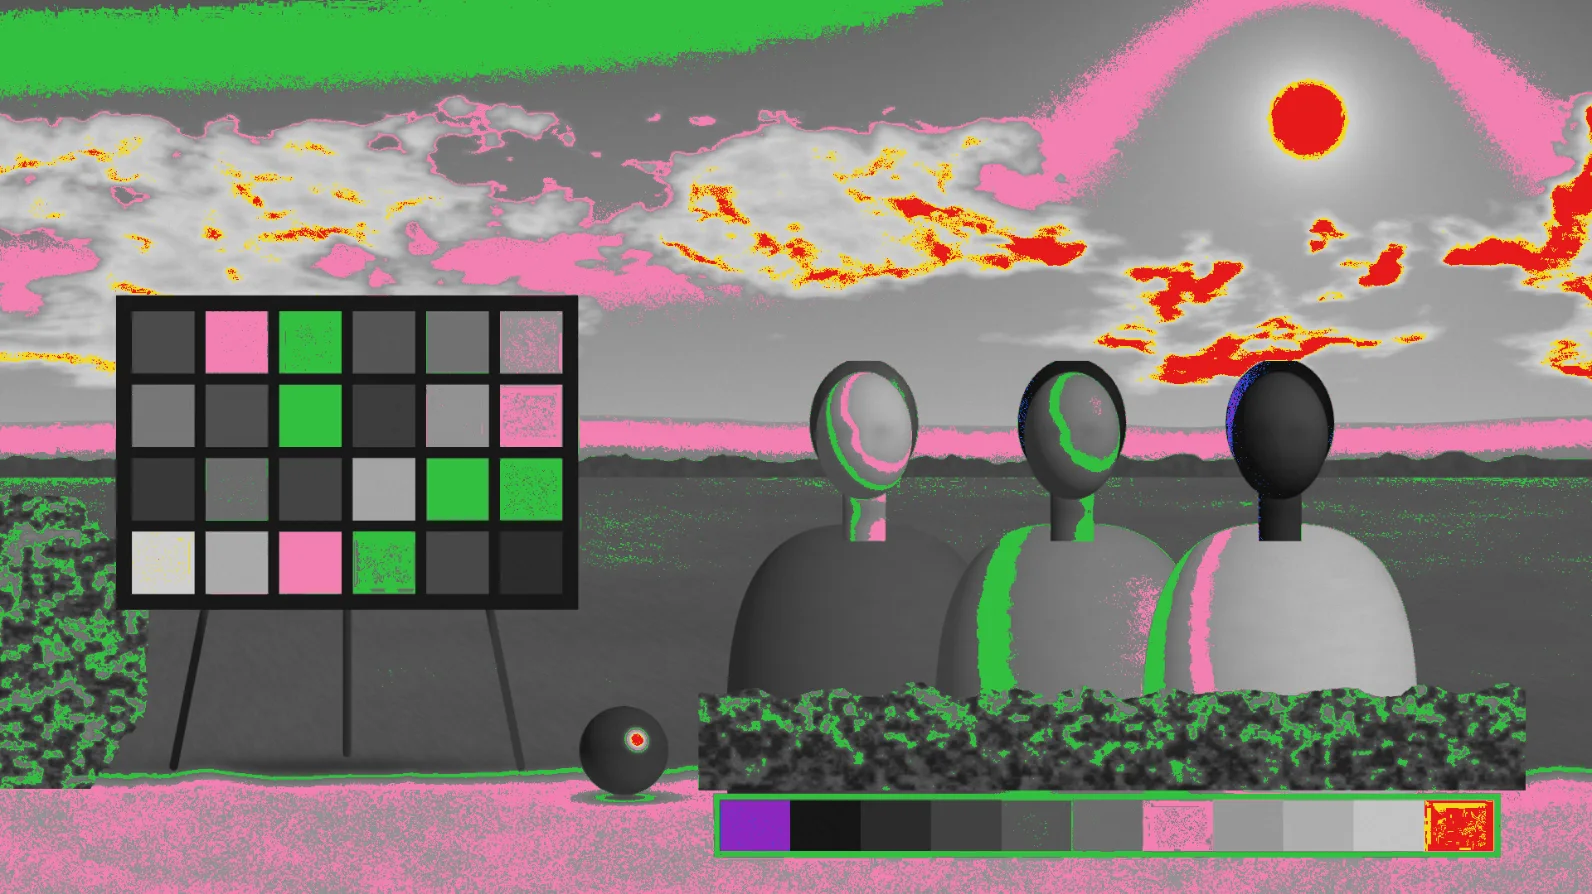
Scopes tell you that something is at 100%; the View menu tells you where. False colour greys out the picture and paints specific level bands in colour, so you can read levels directly on the subject:
- Purple: crushed black, below 2.5%.
- Blue: near black.
- Green: 18% grey, 41-48%. Useful for placing a grey card or a mid-toned subject.
- Pink: one stop over grey, 60-66%, where light skin often sits.
- Yellow: near white, 97-99.5%.
- Red: clipped.
Clipping is stricter and colour-aware: red stripes mark pixels where a channel has reached 100%, blue where all channels are at 0, and yellow where one channel has crushed inside a colour. That last case matters for saturated reds and blues, which can lose a channel while their luma looks perfectly fine on the waveform.
 (enlarge image)
False colour puts level bands on the picture: green is mid grey.
Reading a colour chart on the scopes
The demo footage, chart-scene, holds a 24-patch colour chart in the ColorChecker layout, an 11-step grey wedge, sky, grass, three faces and a red object. Ungraded, it shows you what correct looks like:
- The grey wedge draws an even staircase on the Waveform, and three identical staircases on the Parade.
- The chart’s bottom row of six neutral patches collapses to one tight dot at the centre of the Vectorscope.
- The chart’s red, green, blue, yellow, magenta and cyan patches point towards their targets, well inside them, as real surfaces do.
- The two skin patches and the three faces fall along the skin tone line, at different distances from the centre.
Now change one thing at a time and watch which scope responds. Raise Temperature and the parade splits while the vectorscope dot slides towards orange. Raise Saturation and the vectorscope grows outwards, but the waveform barely moves. Push Whites too far and the top of the waveform flattens while Clipping stripes the white patch red. A table of what to look for:
| What you see | What it means | Where to fix it |
|---|---|---|
| Flat line at 100% on the waveform | Clipped whites | Whites, Highlights, Gain |
| Trace bottom well above 0% | Lifted, flat blacks | Blacks, Lift |
| Parade traces at different heights on neutrals | Colour cast | Pick white, Temperature, Tint |
| Vectorscope cloud off-centre | Overall cast | Offset, Temperature |
| Faces off the skin tone line | Skin hue wrong | Secondary on skin |
| Colours past the 75% targets | Over-saturated | Saturation, Hue vs Sat |
With that vocabulary, the next chapter, contrast and tonal range, uses the waveform and false colour to set black, white and mid grey on a flat version of the same chart. If you only need a quick fix rather than the theory, correct the colour of a video with Auto colour and check the result on the scopes afterwards.
Read the scopes on a test chart
Open a clip with a grey or white reference, show the waveform and vectorscope, and watch how each control moves them.
- 1
Open a clip and switch to Pro
Choose Open video or photo, then switch the top bar to Pro so the Scopes column appears.
- 2
Show level and colour
Pick Waveform and Vectorscope. Find the neutral areas: a staircase or flat band on the waveform, a dot at the centre of the vectorscope.
- 3
Check balance on the parade
Swap Waveform for Parade and compare the red, green and blue traces over something neutral. They should be the same height.
- 4
Move one control and watch
In Adjust, raise Temperature and then Saturation, one at a time, and note which scope responds to each. Double-click a slider to reset it.
- 5
Check the extremes on the picture
Open the View menu and choose False colour, then Clipping, to see where the darkest and lightest areas sit. Return to Normal before judging colour.
Drop a video or photo to colour gradeChoose a video or photo to grade
Opens in the studio: looks and Auto colour for a quick result, wheels, curves, masks and scopes when you want more.It opens in the studio on your phone. Nothing is uploaded.
MP4, MOV, WebM, MKV, JPG, PNG, WebP
Free · no watermark · graded on your device, never uploaded